New York City is filled with different pockets of nearly every ancestry group. African Americans predominate in neighborhoods like Crown Heights/Bedford-Stuyvesant, East New York, Far Rockaway, Harlem and Jamaica. Neighborhoods like Eastchester in the Bronx, Flatbush & Midwood in Brooklyn, and Eastern Queens are filled with Caribbean groups.
East Asian groups dominate around Flushing & Elmhurst Queens, Chinatown in Manhattan, and Bensonhurst & Sunset Park in Brooklyn while, South Asians are concentrated in Ozone Park, Richmond Hill, Jamaica, Queens Village, and Woodside in Queens.
Within the Hispanic Community, Puerto Ricans comprise the largest group in East Harlem and throughout Southern Bronx. The Dominican population is predominate throughout Eastern and Northern Bronx, Washington Heights in Manhattan, and Cypress Hills & Bushwick in Queens. New York City is also one of the few places in the country with a large South American population predominantly in Corona & Jackson Heights in Queens.
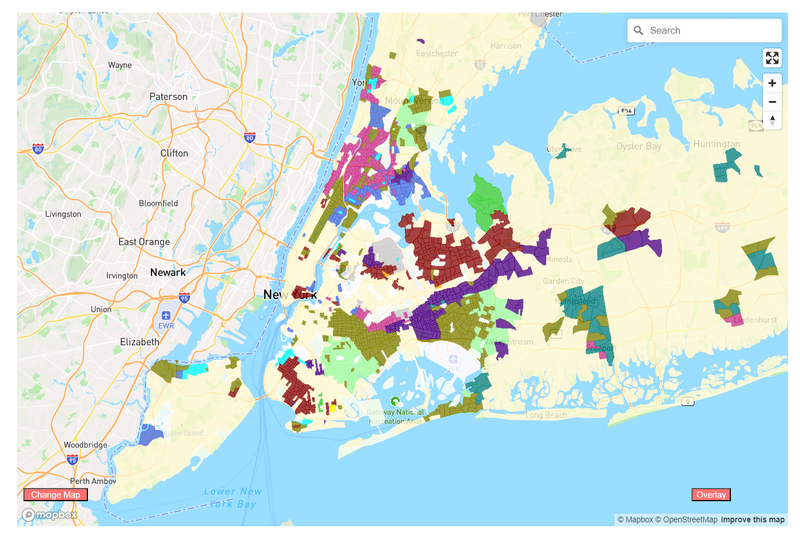
Exploring outside of the City, you can find Middle Eastern & North African Communities in Kings Point & Great Neck in Nassau. Nassau County is also home to Caribbean populations in Valley Stream and Central American areas in Hempstead, Uniondale, Freeport, & Westbury.
We can dig a little deeper into this data to show ancestry trends in the rest of New York by switching the display to show the second largest ancestry group in each tract. Click the "Change Map" button on the bottom left, then "Top Group", then "2nd".
By looking at the 2nd largest group, you can still see some of the big picture trends outside of NYC, for example in the Hudson Valley the region appears dominated by Puerto Ricans while Westchester and Rockland Counties have large concentrations of East Asians & South Asians, respectively.
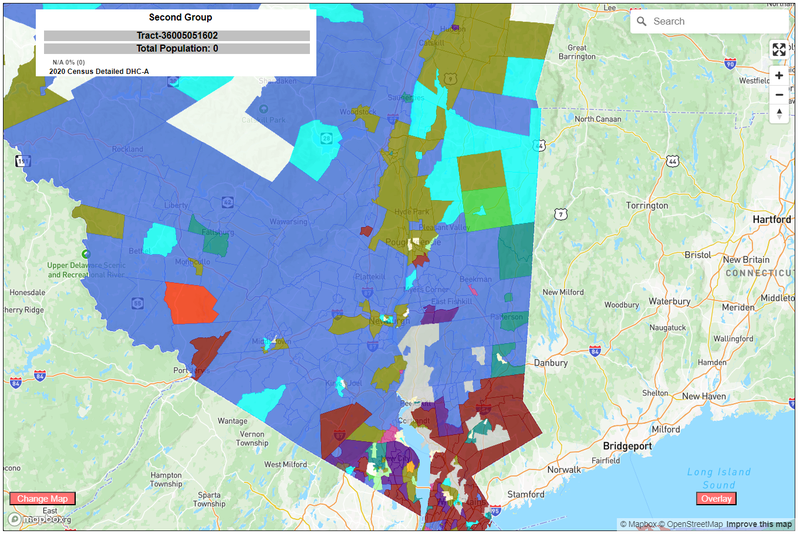
Continue to explore the interesting trends seen throughout the state looking at the 2nd group to go beyond the surface level 1st largest groups.
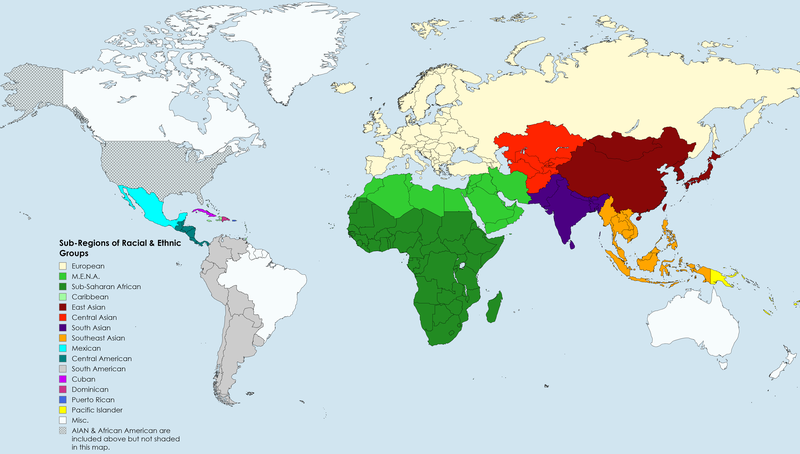
The image below depicts the countries classified within each regional group per the Census Bureau. There are two groups, Alaskan Native/American Indian Group and the African American, that are not shown on the map, despite their classification as "regional groups" in the interactive map.