
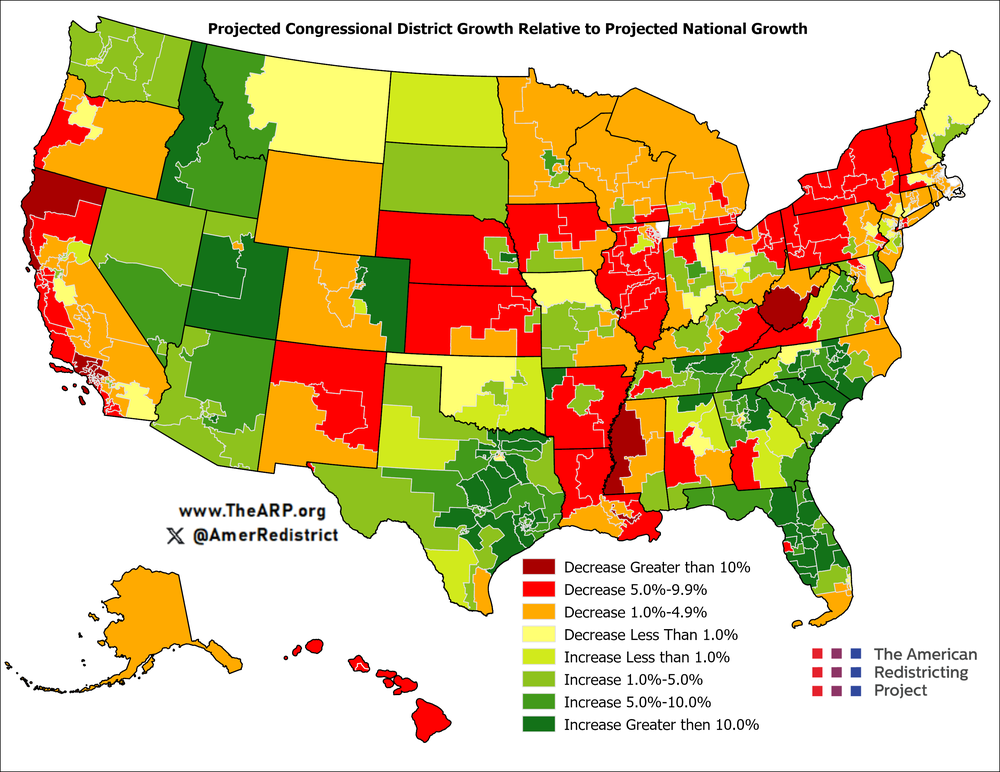
The Census Bureau releases figures each year to estimate the current population. Many pundits, political organizations, and government agencies utilize these population estimates to create forecasts for future population changes. However, many of these estimates have a potential flaw: they fail to look at the “Components of Change.” This analysis used the Vintage 2025 PEP Components of Change to forecast how the population would grow in each county and then aggregated up to the currently enacted congressional districts (as of September 2026). This allows us to see whether an area is growing from natural change (births and deaths), domestic migration (people moving within the country), international migration (people moving into/out of the country), or a combination of these factors.
South Florida and New England may look comparable at the total forecast level when merely looking at the growth rate, but very different when looking at what type of growth they are experiencing. The vast majority of South Florida's population growth is due to exceedingly large international migration rates, at more than four times the national average. This is balanced out by nearly equally large domestic out-migration. In contrast, much of New England outside of the Greater Boston metropolitan statistical area has relatively healthy domestic in-migration balanced out by negative natural change numbers.
Major Cities Decline
Of the top forty cities by population, thirty-one share the same pattern: Positive natural change, negative domestic migration, and weak growth, if not decline relative to the nation. This is largely an urban phenomenon. Of the 181 congressional districts with this pattern, nearly 90% are in urban and suburban areas. These areas tend to be ones we might expect to decline. The vast majority of California, the NYC metro area, Chicagoland, Philadelphia, Memphis, Detroit, and Baltimore are all included in this category. However, more unexpected localities are also in this camp, such as Atlanta, Denver, the DFW area, and Salt Lake City. What unites these places is that they are the established, well-known, large metropolises of the nation.
Suburbanization
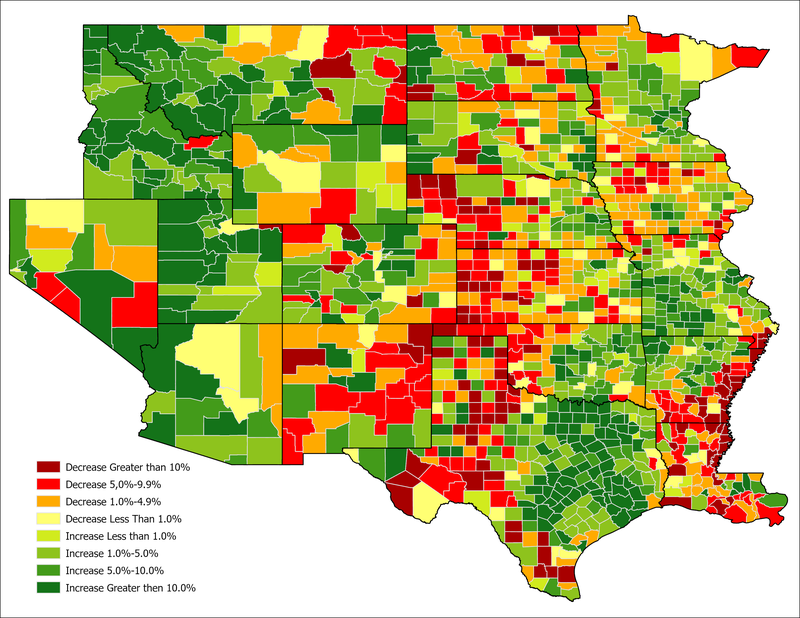
While many of the largest cities decline, the Mountain West and the Midwest west of the Mississippi River are experiencing a very different phenomenon. From Arizona to Montana to Missouri, urban centers and their suburbs are growing while rural areas are stagnant or declining. Pinal County is the fastest growing county in Arizona, at more than 5 times the growth of Maricopa County. In Idaho and Montana, and throughout the Great Plains, the fastest growing counties are within Metropolitan Statistical Areas. Iowa’s main sources of growth are the Des Moines area and the Cedar Rapids area. Minnesota is experiencing the same phenomenon just outside of the Twin Cities. There is a clear trend of suburbanization that extends all the way from Nevada out to even Oklahoma and Arkansas.
Texas and Florida
Both suburbanization and urban decline are on display in the fast growing states of Texas and Florida. In Texas, the vast majority of large urban centers are experiencing decline. Each of the six largest metropolitan areas in the state are growing slower than the state, and only San Antonio is experiencing positive domestic migration. At the same time, the suburban counties directly surrounding these declining metropolises are experiencing explosive growth. Collin, Denton, and Montgomery Counties are projected to have 41 percent, 32 percent, and 50 percent growth rates, respectively. The same is true for Florida. While Orlando, Miami, Fort Lauderdale, and Jacksonville grow slower than the state, St. Johns County is the fastest growing county, with Osceola, St. Lucie, and Polk Counties not far behind. Although Texas and Florida are undoubtedly growing, their growth is concentrated in suburbs of established metropolitan areas, and extremely dependent on domestic migration, with 70 percent and 95 percent of growth attributable to transplants, respectively.
Methodology
The American Redistricting Project used the Vintage 2025 PEP Components of Change to forecast how the population would grow in each county. A 3-year rolling average was utilized to forecast natural change and domestic migration, while 2025 levels of international migration were kept steady for the remainder of the decade. Each county (or proportion of a county) was then aggregated up to the congressional district level for district population figures. This methodology projects a nationwide 2030 population of approximately 349.6 million, an increase of nearly 18 million (Natural change = 4.5 million, International Migration= 14.3 million) since the 2020 Census.