Past Congressional and State Legislative Shapefiles
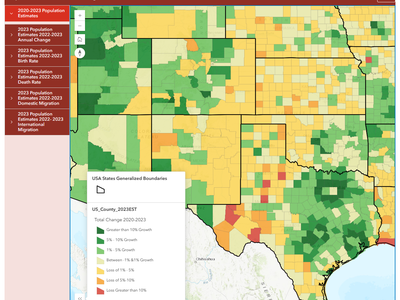
Dive deeper into the county level population changes since the 2020 Census in the map below. Examine birth rates, death rates, international and domestic migration rates for each county from April 2020 to July 2025.
iFrames are not supported on this page.
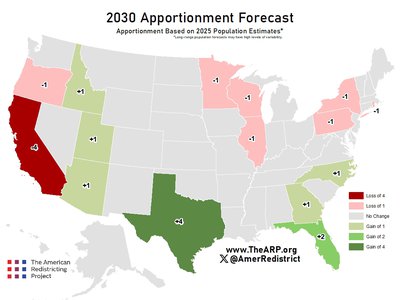
Last year, ESRI published their Updated Demographics Dataset which included a 2025 population estimate. This population is sourced from U.S. Census Bureau products, building permits, housing starts...
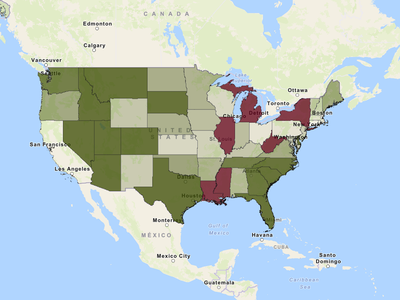
Citizen Population from the 2024 American Community Survey 5-Year Estimates
Total Citizen and Non-Citizen Population The ACS 5-year Estimates from 2020-2024 peg the total resident population of the United States at 334,922,499 including 312,247,827 citizens (93.2% of ...
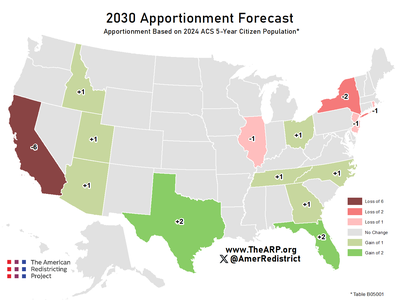
As of July 1, 2025.
Congressional representation is reapportioned every decade following the completion of the decennial census. The Census Bureau's most recent Population and Housing Unit Estimates were releas...

The Founders' Vision The number 435 is now synonymous with the U.S. House of Representatives. Yet, 435 is not enshrined anywhere the Constitution. The size of the House of Representatives i...
Background As we introduced in Uncapping the House - Pt. 1 - The Wyoming Rule, many advocates for redistricting reform have looked to increasing the number of Representatives elected to the Hous...
Breaking down the 2025 & 2030 district-level population estimates of the 119th Congress
Background Many advocates for redistricting reform point to the size of the House of Representatives as one of the barriers to "fair maps" and inadequate representation. The average co...
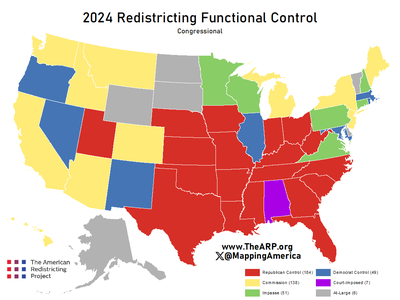
EXPECTATIONS At the beginning of the 2020 redistricting cycle, we published a blog post detailing who controlled the redistricting process in each state. But the realities of the cycle - from ...
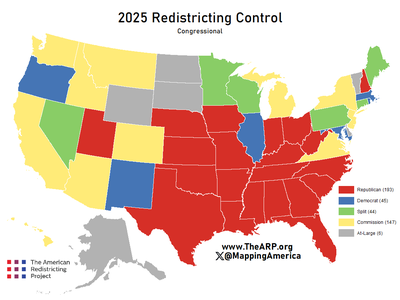
Redistricting control as of January 20, 2025.
Congressional Redistricting Republican Control (21 States - 193 Seats): Alabama, Arkansas, Florida, Georgia, Indiana, Iowa, Kansas**, Kentucky**, Louisiana, Mississippi, Missour...
Citizen-Initiated Amendments Nevada Initiative: C-03-2023 and C-04-2023 . RULED DEFICIENT. Proponents: Fair Maps Nevada Signatures Required: 102,362 Collection Deadline: J...