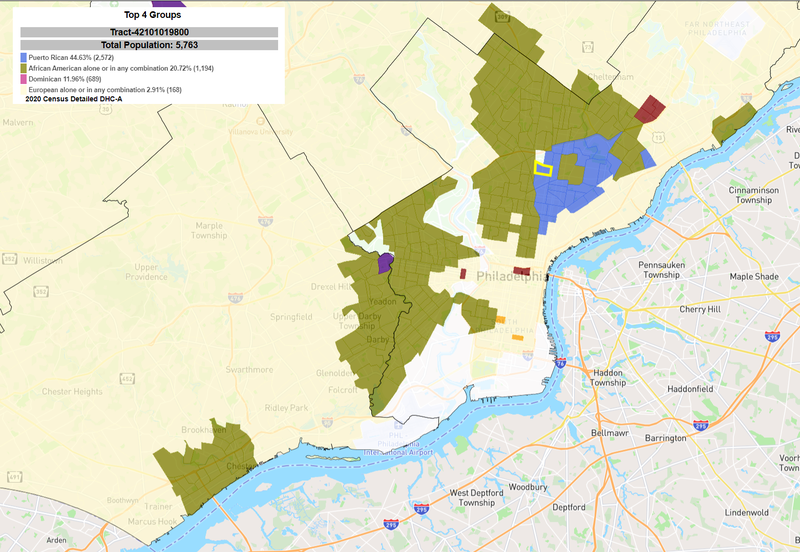
The largest city and most diverse area in Pennsylvania is the Philadelphia Metro. The area has significant African American, Puerto Rican, and European populations with smaller pockets of Dominican, South Asian, Southeast Asian, East Asian, and even Sub-Saharan African ancestries. Those smaller populations are easily identifiable when looking at the second-largest group in each tract.
Pennsylvania's second largest city, Pittsburgh has much less ancestral diversity than Philadelphia. Most of the area is predominantly European with a few areas of African-American ancestry. There are smaller, more spread-out communities of Middle Eastern/North African, South Asian, and East Asian ancestries.
Central Pennsylvania is predominantly European - especially German ancestry. This area of Central Pennsylvania has such a high concentration of European ancestry and has relatively low population that much of the smaller ancestry groups are below the minimum population threshold for privacy concerns imbued into the data. These areas will appear white will using the 2nd, 3rd, and 4th place options emphasizing the uniformity of this area.
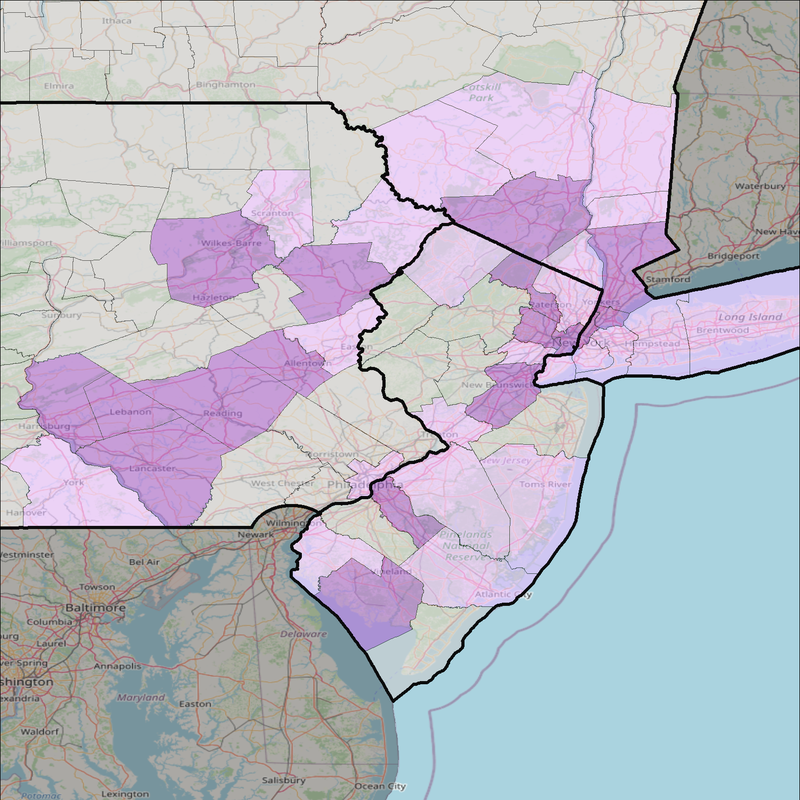
As previously discussed in our New York Ancestry post, there has been widespread growth of Puerto Rican and Dominican ancestries surrounding the New York City area. This growth has even extended into parts of Pennsylvania and New Jersey. Nearly 8% of the entire NY-NJ-PA population claims either Puerto Rican or Dominican ancestry; much higher than the national average of 1.75%. The image below highlights the counties with greater than 5% Puerto Rican & Dominican shaded light purple and the counties with greater than 10% shaded in dark purple.
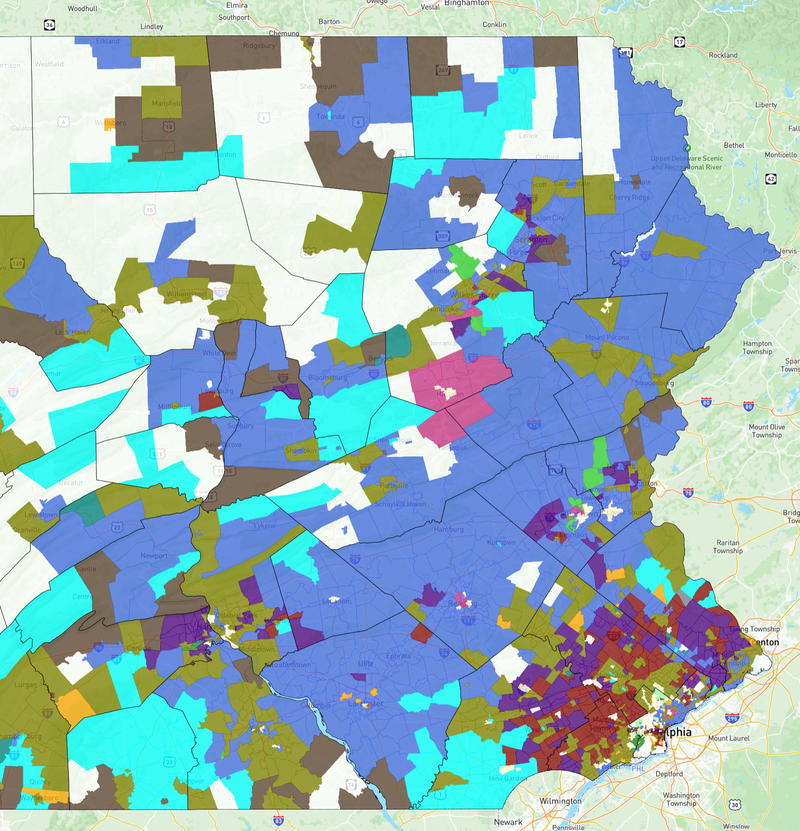
Pennsylvania's "Latino Belt" has been growing; stretching from Northeast PA through the Lehigh Valley down into Lancaster and York Counties. This area of Pennsylvania was featured in a Politico article by Charles F. McElwee, "A Growing Latino Belt is About to Reshape Politics". The article discusses the history of this region with Dominican and Puerto Rican communities working in the historical agricultural and manufacturing industries and the continued influx of residents from New York City.
Continue to explore the interesting trends seen throughout the state looking at the 2nd group or Group Percentages to go beyond the surface level 1st largest groups.
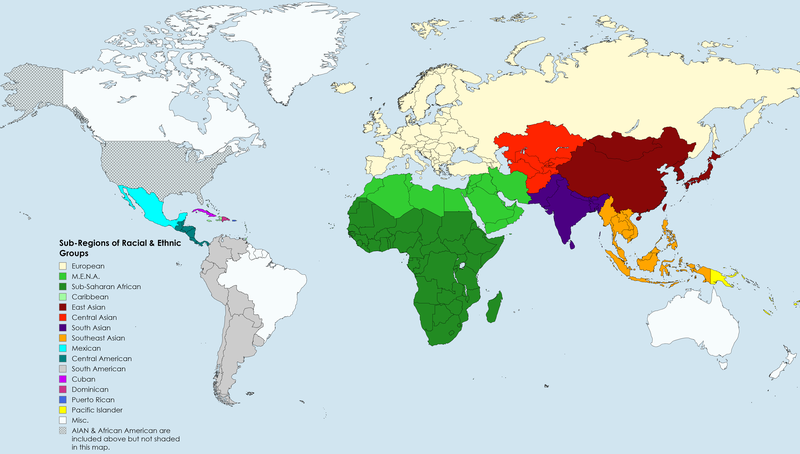
The image below depicts the countries classified within each regional group per the Census Bureau. There are two groups, Alaskan Native/American Indian Group and the African American, that are not shown on the map, despite their classification as "regional groups" in the interactive map.