Florida is known for its large Hispanic population, especially the large Cuban populations in South Florida. However, Florida has an exceptionally diverse Hispanic population with concentrations of people with Cuban, Puerto Rican, Mexican, South American, and Central American heritage throughout the state. Florida also has large African American and Caribbean populations.
Miami-Dade is home to clusters of Caribbean populations in places like North Miami, Miami Shores, and Little Haiti while Miami Gardens, Opa Locka, and Overtown are predominately African American. There are also large Caribbean communities in Broward, Palm Beach, and Orange Counties.
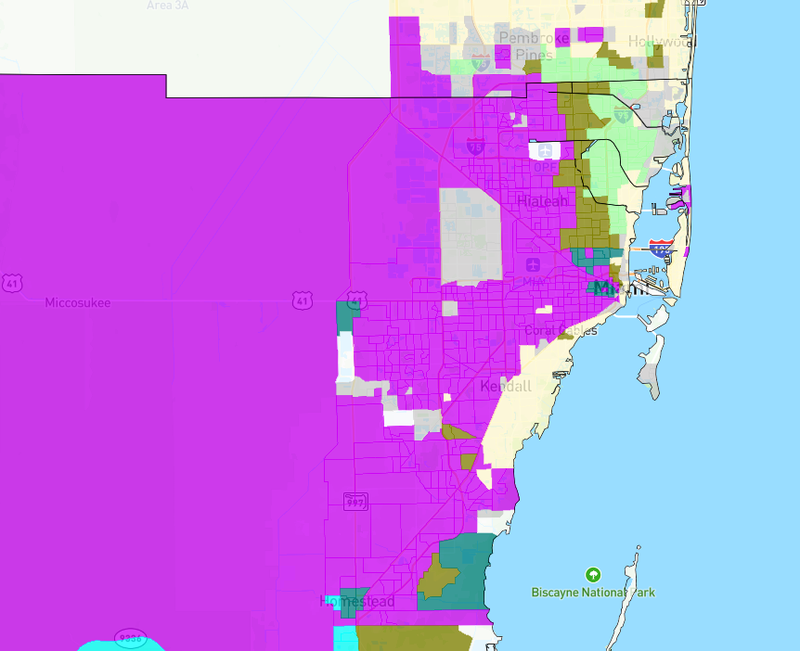
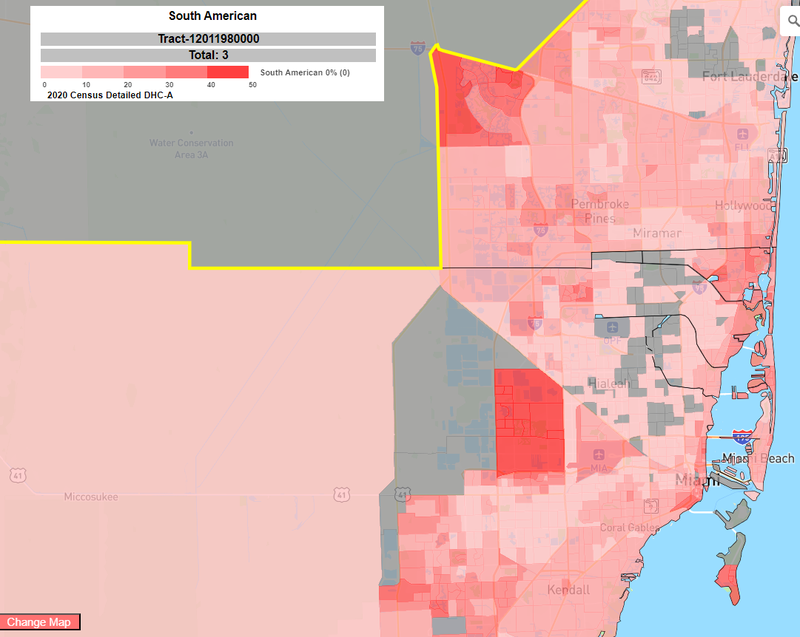
Miami-Dade County is famous for their Cuban populations in Hialeah, Miami & the surrounding areas. Less well known are Miami's South & Central American populations; for a better visualization of these communities switching the display to show a 'heat map' of each ancestry group. Click the "Change Map" button on the bottom left, then "Group PCT", then select the group. In South Florida, Weston, Doral, Aventura and Miami Neighborhoods like Brickell & Edgewater are predominately South American. While Homestead and Miami Neighborhoods Riverside & Allapattah have growing Central American communities.
Hispanic communities are not limited to South Florida though. There are Mexican populations surrounding agricultural-focused Lake Okeechobee, Cuban communities in Tampa, with a quickly growing Puerto Rican population in Central Florida. We can dig even deeper into the growing Puerto Rican community by switching the display to show the second largest ancestry group in each tract. By looking at the 2nd largest group, you can that nearly every county in Central Florida has Puerto Rican as the 2nd largest group.
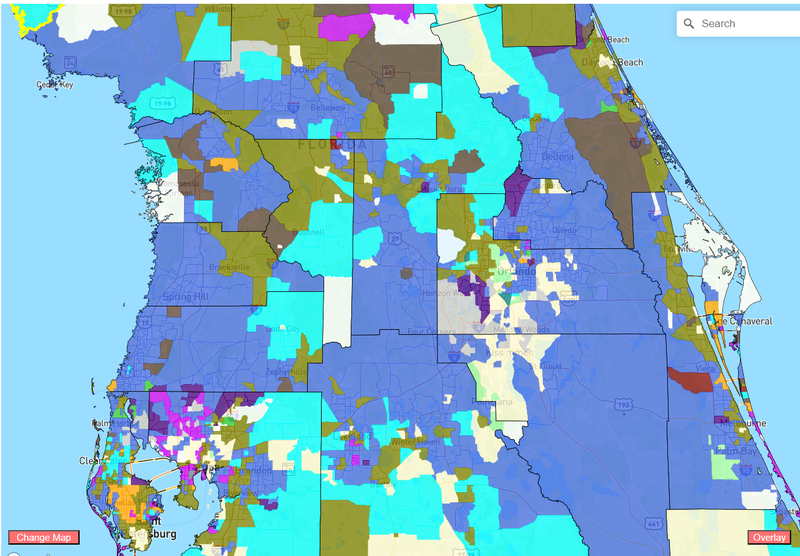
Continue to explore the interesting trends seen throughout the state looking at the 2nd group or Group Percentages to go beyond the surface level 1st largest groups.
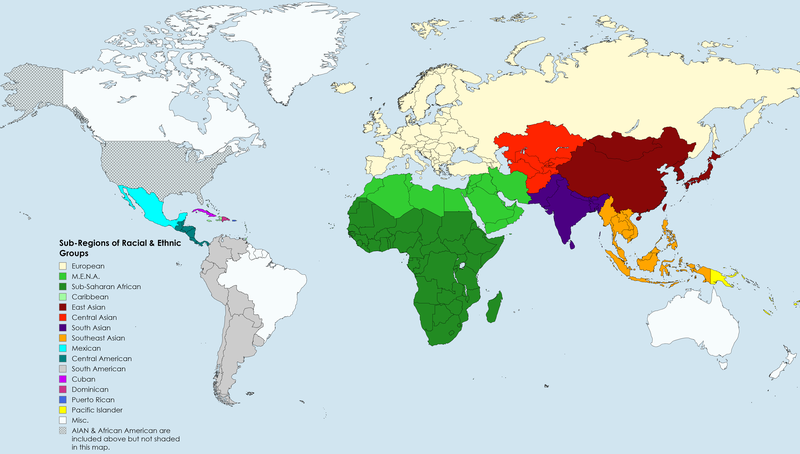
The image below depicts the countries classified within each regional group per the Census Bureau. There are two groups, Alaskan Native/American Indian Group and the African American, that are not shown on the map, despite their classification as "regional groups" in the interactive map.