At first glance the ancestry characteristics of those residing in the Great Lakes appear almost uniformly European, but upon closer inspection other interesting characteristics emerge. For a better visualization of the composition of the Great Lakes switch the display to show a 'heat map' of each ancestry group to examine the 2nd, 3rd, and 4th largest groups. Click the "Change Map" button on the bottom left, then "Group PCT", then select the group. Two interesting Regional Groups, Sub-Saharan African and Middle Eastern & North African, quickly become apparent.
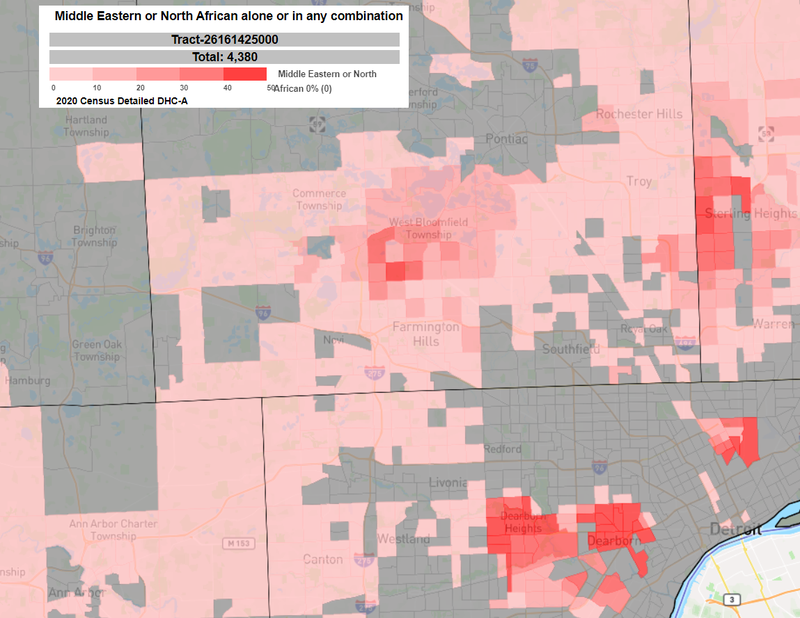
The Middle Eastern & North African group, aka MENA, is spread throughout several large cities in the Great Lakes including Chicago, Cleveland, Indianapolis, and Detroit. The Detroit Metro, pictured above, is especially notable and has large concentrations in areas like Dearborn, West Bloomfield, Hamtramck, and Sterling Heights. The Dearborn and Dearborn Heights areas have some of the highest concentrations of MENA populations in the country. The Minneapolis Metro area has some of the highest concentrations of Sub-Saharan Africa ancestries in the country. Additionally, there is also a sizeable community in Columbus.
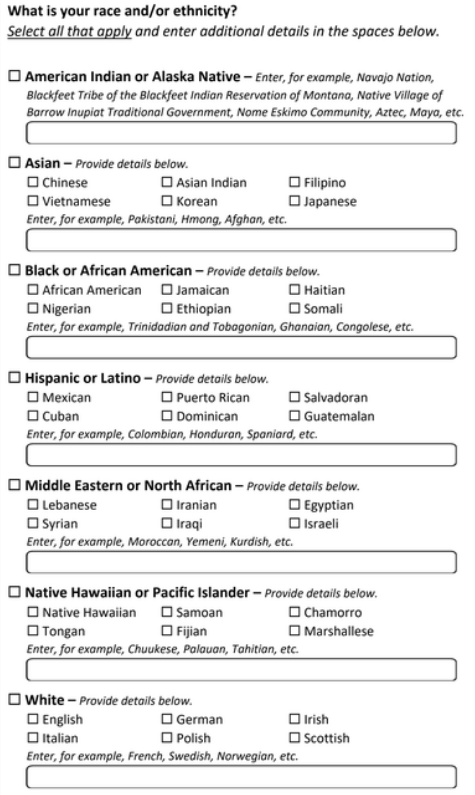
The Sub-Saharan communities in Minneapolis and Columbus and MENA communities around Detroit are some of the only areas in the country where these groups are prevalent enough to impact elections. For the first time, in 2030 MENA will not just be reported as an ancestry but a full question. This week the Census Bureau announced that they will be combining the Race and Ethnicity questions into a single question while also adding a MENA option. In the Detroit area specifically, this will be very interesting to see the implications of this new question.
Continue to explore the interesting trends seen throughout the region by looking at the 2nd group or Group Percentages to go beyond the surface level 1st largest groups!
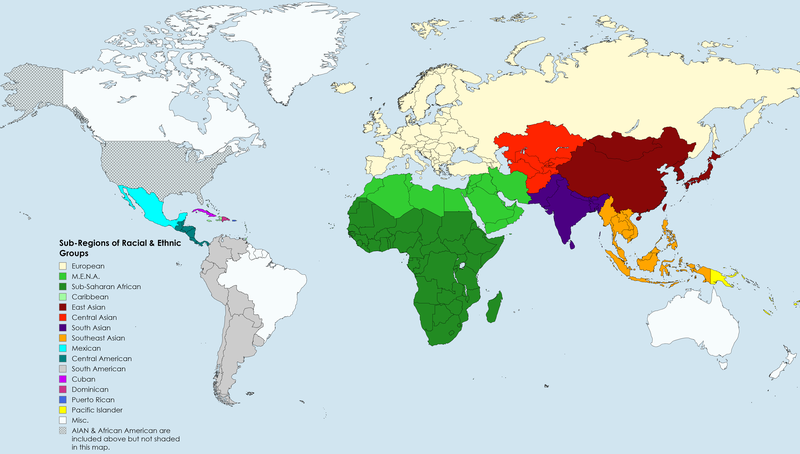
The image below depicts the countries classified within each regional group per the Census Bureau. There are two groups, Alaskan Native/American Indian Group and the African American, that are not shown on the map, despite their classification as "regional groups" in the interactive map.