The Aloha State, Hawai'i is an archipelago in the Pacific Ocean nearly 2,500 miles off the California coast. Hawai'i has a unique and diverse ancestry distribution to match its rich history. The four largest regional groups, spread across the 7 inhabited main islands, are East Asian (35%), European (30%), Southeast Asian (28%), and Pacific Islander (26%). The three largest and most populous islands are Hawai'i (~200k residents), Maui (~155k residents), and O'ahu (home to Honolulu and ~ 1 million residents).
The Islands of Hawai'i and Maui have pockets of Pacific Islanders, Southeast Asians, and East Asians in the islands' larger cities with European pockets outside the cities. However, the distribution patterns seen here are not as pronounced as the patterns seen in O'ahu.
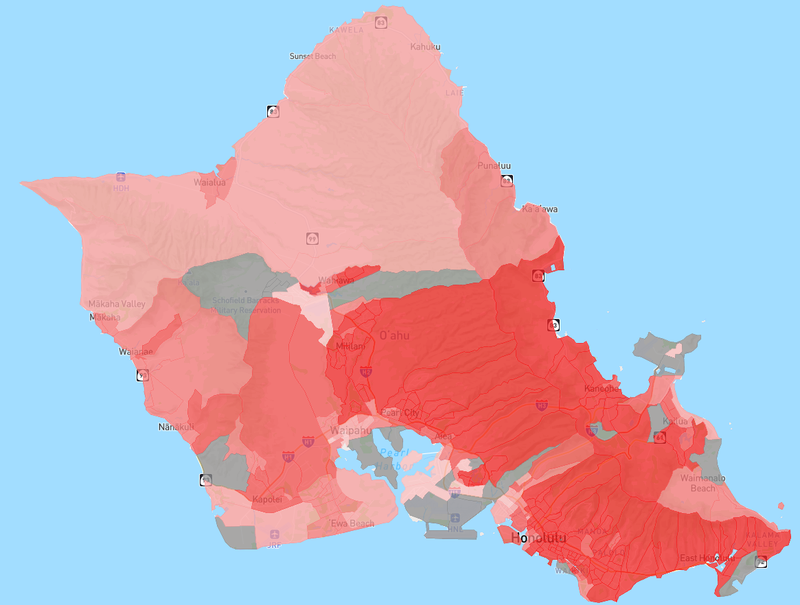
Taking a closer look at O'ahu, the Eastern and Central portions are predominately East Asian as seen in the image below. O'ahu's East Asian community is predominantly composed of those with Japanese ancestry.
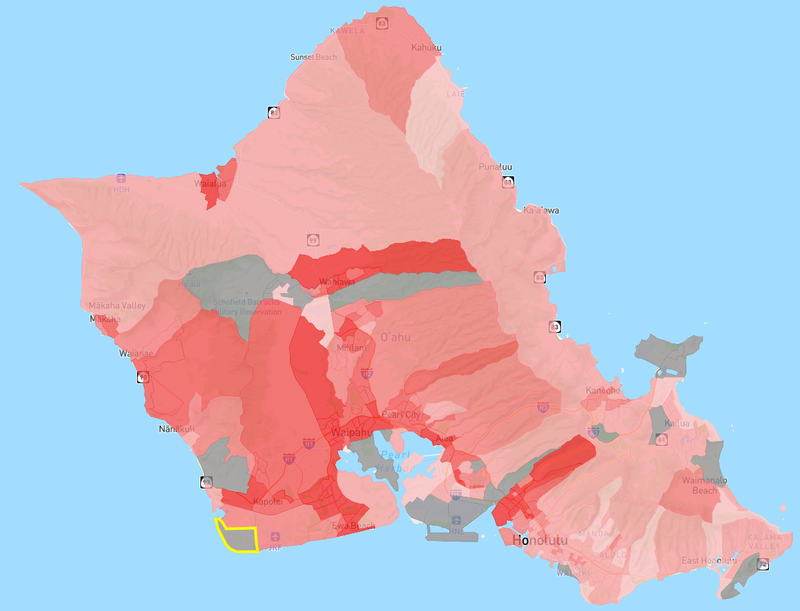
Meanwhile the Southeast Asian Community, which is predominately Filipino, are concentrated on the Southwestern portion of the island. The image below shows pockets of SE Asians in Downtown Honolulu, Waialua, and Wahiawa.
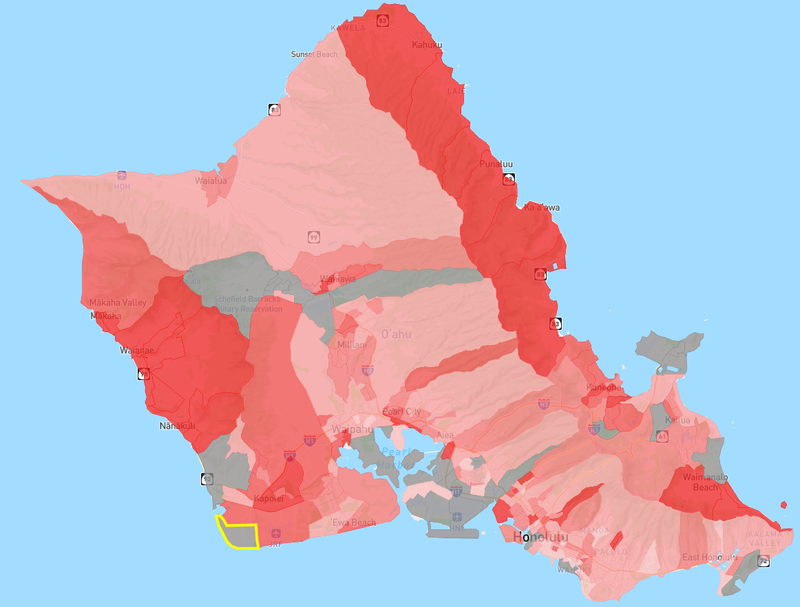
The image below shows the Pacific Islander communities are concentrated along the Northeast and Southwest stretches of the O'ahu. They also are more prevalent on the other islands, outside of O'ahu.
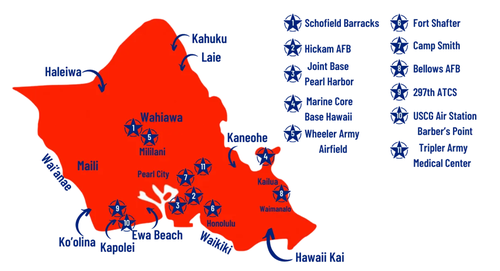
Unlike the other ancestries, the distribution patterns of the European group is less pronounced. But the largest concentrations are surrounding the US Military bases on O'ahu. The island is home to bases for each branch of the military with the Army's Schofield Barracks, Air Force and Navy Joint Base Pearl Harbor, Marines Corps Base Hawai'i located near Kaneohe Bay, and the Coast Guard's Air Station Barbers Point. The image below shows all the bases throughout O'ahu.
Continue to explore the interesting trends seen throughout the state looking at the 2nd group or Group Percentages to go beyond the surface level 1st largest groups.
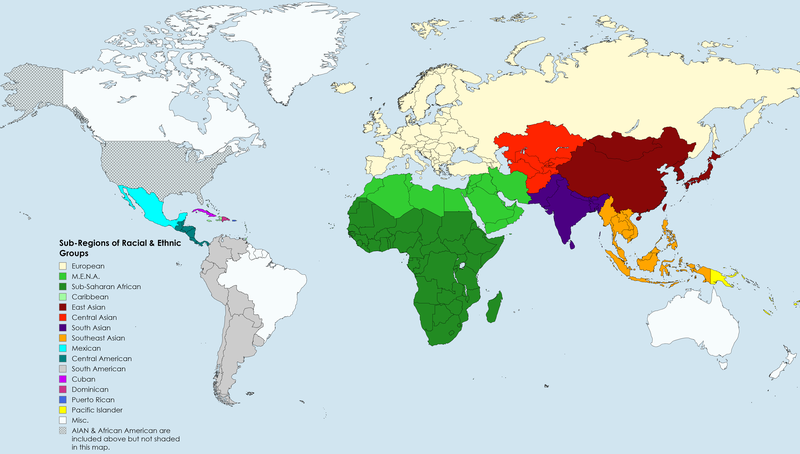
The image below depicts the countries classified within each regional group per the Census Bureau. There are two groups, Alaskan Native/American Indian Group and the African American, that are not shown on the map, despite their classification as "regional groups" in the interactive map.