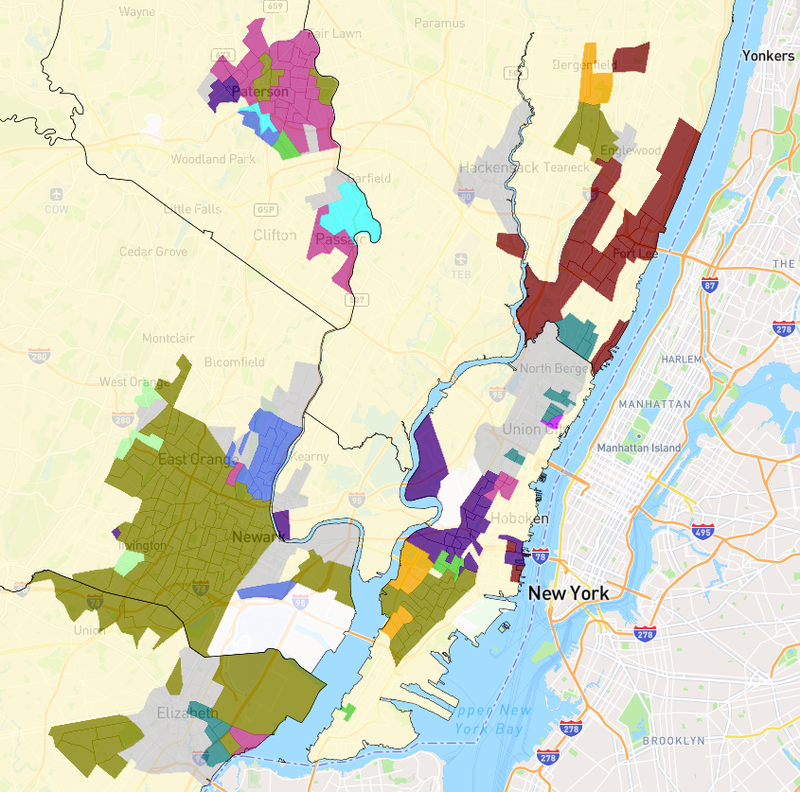
New Jersey has large populations with African American, East Asian, South Asian, Southeast Asian, Puerto Rican, Dominican, Central American, and South American ancestries. Most of this diversity is concentrated in Northeast New Jersey. Newark and nearby towns are predominately African American communities with smaller Dominican and South American communities. Nearby Jersey City has strong communities of South Asian, Southeast Asian, African American, European, and Middle Eastern/ North African communities, making Jersey City one of the most diverse places in the Garden State. Moving north along the Hudson River North Bergen. Union City, and West New York are heavily Hispanic with a large concentration of South Americans along with sizable numbers of Central American and Cuban ancestries. Continuing north, Bergen County has a growing population of those with East Asian ancestries specifically in Fort Lee and Palisades Park. Patterson is another diverse heavily Hispanic city, with a large Dominican population.
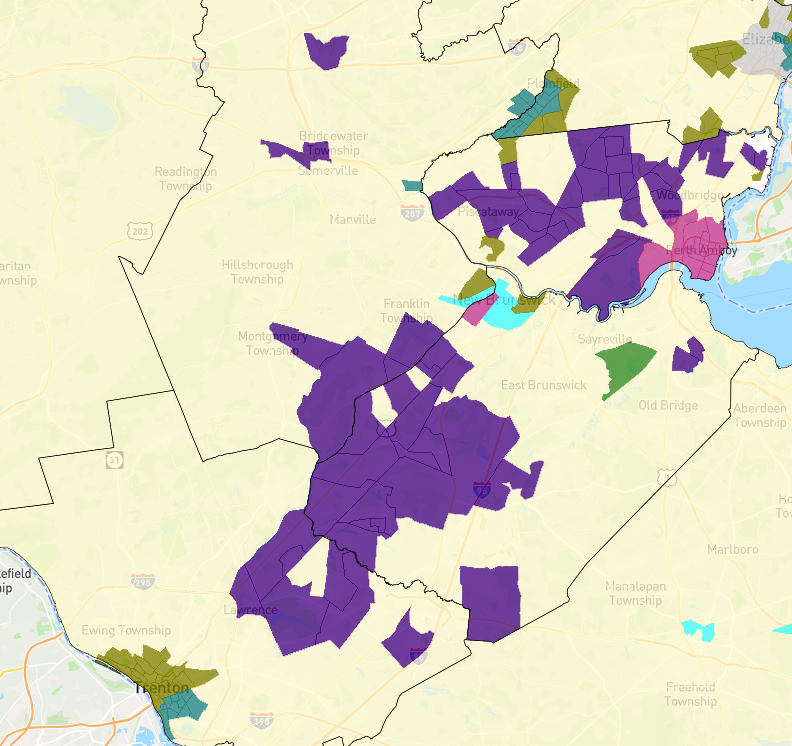
Meanwhile in Central Jersey, there has been a growing South Asian community. This growth is largely taking place around Middlesex County between Princeton and the surrounding areas to New Brunswick, home to Princeton University and Rutgers University respectively. Also in Middlesex County is Perth Amboy, home to a large Dominican population. The capital of the Garden State, Trenton, is evenly split between African American and Central American ancestries.
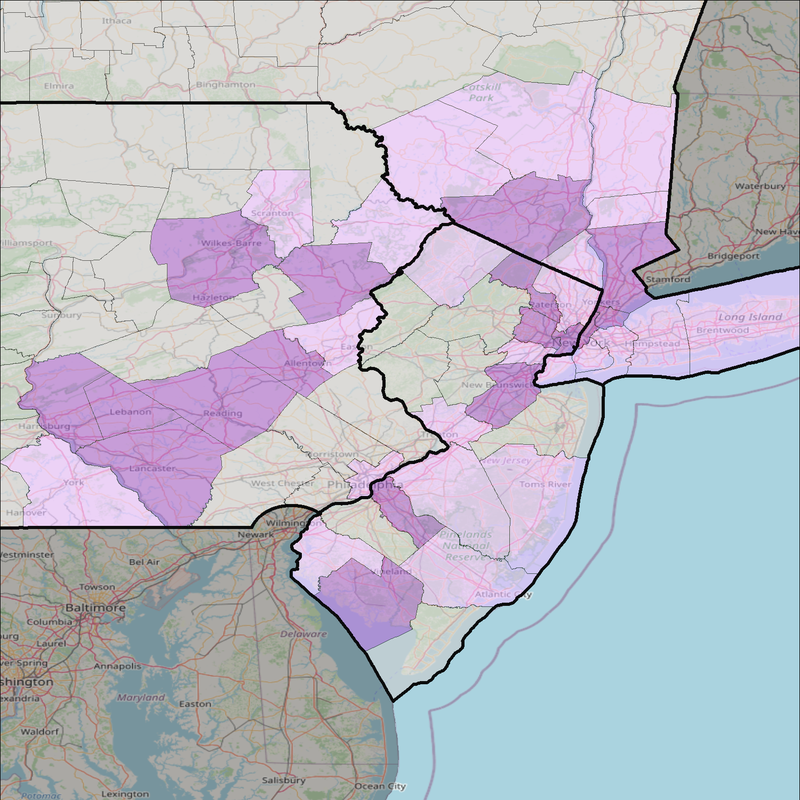
As previously discussed in our New York and Pennsylvania posts, there has been widespread growth of Puerto Rican and Dominican ancestries surrounding the New York City area, extending into parts of Pennsylvania and New Jersey. Nearly 8% of the entire NY-NJ-PA population claims either Puerto Rican or Dominican ancestry; much higher than the national average of 1.75%. The image below highlights the counties with greater than 5% Puerto Rican & Dominican shaded light purple and the counties with greater than 10% shaded in dark purple.
Continue to explore the interesting trends seen throughout the state looking at the 2nd group or Group Percentages to go beyond the surface level 1st largest groups.
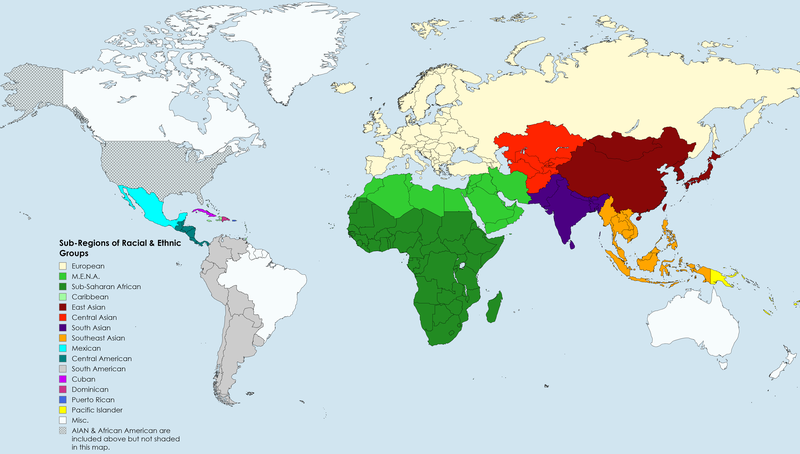
The image below depicts the countries classified within each regional group per the Census Bureau. There are two groups, Alaskan Native/American Indian Group and the African American, that are not shown on the map, despite their classification as "regional groups" in the interactive map.