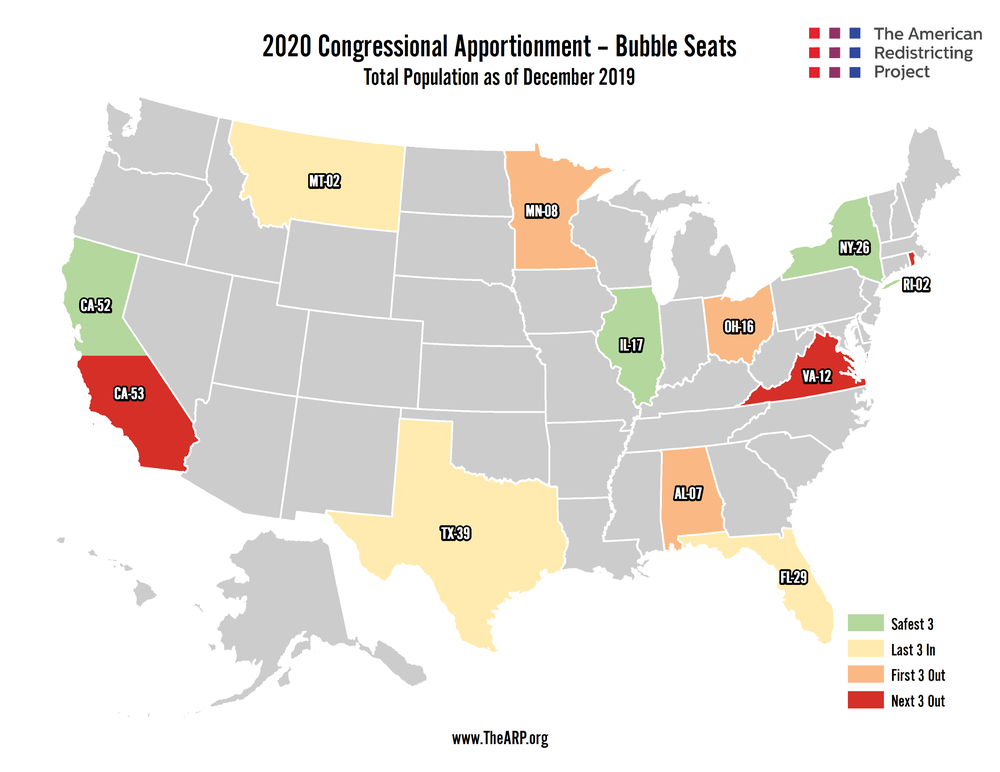
If there are any surprises with the 2020 reapportionment (not impossible given the uncertainty surrounding the Census this year) look no further than these twelve “Bubble Seats.”
What Are Bubble Seats?
The House of Representatives is made up of 435 seats. Every state receives one seat and the final 385 are apportioned (or allocated) to the states based upon their total population. When forecasting the number of seats in Congress apportioned to each state there is always some uncertainty at the margins – especially in the last six seats apportioned.
Below are notes on the last six seats apportioned (“In”) and the first six seats not apportioned (“Out”) according to our 2020 reapportionment forecast.
Bubble seats are determined by their priority value, a number determined by an algorithm considering the population of the state and the number of districts in comparison to other states and their district population sizes. The priority value algorithm can be found on www.census.gov.
According to our estimates the dividing priority value between seat 435 and 436 will be about 760,000. In 2010, the 435th priority value was 710,231 (MN-08). The 436th was NC-14’s 709,063.
2020 Bubble Seat Estimates

The last six apportioned (seats 430, 431, 432, 433, 434, 435) are broken out into the “Safest 3” and the “Last 3.” The safest seats of those six are 430, 431, and 432. The last 3 seats (433, 434, and 435) are the final three seats apportioned.
The Safest 3 In
CA-52 remains at number 430 with a priority value of 768,768. IL-17 moves up one spot to 431 with a priority value of 766,052. NY-26 jumped three spots going from the last seat in following the 2018 estimates and is now seat 432 with a priority value of 761,187.
| 430 | CA-52 | Priority Value: 768,768 |
| 431 | IL-17 | Priority Value: 766,052 |
| 432 | NY-26 | Priority Value: 761,187 |
The Last 3 In
The last three in (seats 433, 434 and 435) are FL-29 (761,047) which dropped from seat 431 to seat 433, MT-02 (760,520), and TX-39 (760,204). FL-29 dropped from 431 last year to 433 this year while MT-02 and TX-39 both slipped one spot.
| 433 | FL-29 | Priority Value: 761,047 |
| 434 | MT-02 | Priority Value: 760,520 |
| 435 | TX-39 | Priority Value: 760,204 |
The first six seats not apportioned (seats 436, 437, 438, 439, 440, 441) are broken out into the “First 3 Out” and the “Next 3 Out.” The seats with the best chance of being apportioned are 436, 437, and 438. Seats 439, 440, and 441 are the next three in contention.
The First 3 Out
Seats 436, 437 and 438 are AL-07 (758,152), MN-08 (757,448), and OH-16 (755,361). AL-07 advanced three places between 2018 and 2019, MN-08 dropped one, and OH-16 held steady.
| 436 | AL-07 | Priority Value: 758,152 |
| 437 | MN-08 | Priority Value: 757,448 |
| 438 | OH-16 | Priority Value: 755,361 |
The Next 3 Out
The next three out (seats 439, 440, 441) are CA-53 (754,124), RI-02 (749,635) and VA-12 (745,546). CA-53 continues to fall, losing three spots in the past year. RI-02 and VA-12 swapped spots.
| 439 | CA-53 | Priority Value: 754,124 |
| 440 | RI-02 | Priority Value: 749,635 |
| 441 | VA-12 | Priority Value: 745,546 |
Shifting Seat Priorities
Reapportionment forecasts are updated every year with the Census Bureau’s annual population estimates release. The chart below shows how seats have trended since 2011. Note the consistent upward trends of NC-14 and AZ-10 and the precipitous decline of NY-26.

