Census Report
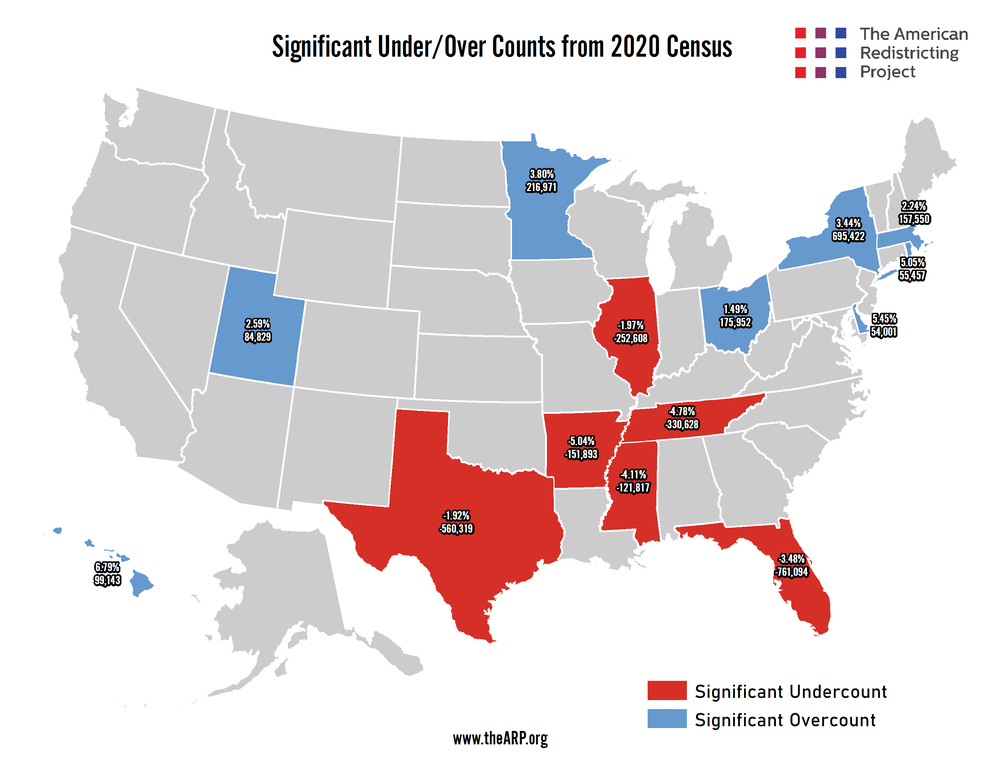
On May 19, 2022, the U.S. Census Bureau released the 2020 Census estimated overcount and undercount rates by State derived from the 2020 Post-Enumeration Survey (PES). The PES is used to estimate the accuracy of the population figures reported by the decennial census to improve the Census Bureau’s counting operations for future censuses. According to the report, 14 States are estimated to have had statistically significant net overcounts or undercounts of their state populations in the 2020 Census. States with estimated overcounts include Delaware, Hawaii, Massachusetts, Minnesota, New York, Ohio, Rhode Island, and Utah, while States with estimated undercounts include Arkansas, Florida, Illinois, Mississippi, Tennessee, and Texas. For context, the Census Bureau’s PES report for the 2010 Census found no statistically significant net overcounts or undercounts. The table and map below show each of the statistically significant States and their estimated net overcount or undercount rates.
| State | Overcount (+)/Undercount (-) Rates | |
|---|---|---|
| Hawaii | + 6.79% | |
| Delaware | + 5.45% | |
| Rhode Island | + 5.05% | |
| Minnesota | + 3.84% | |
| New York | + 3.44% | |
| Utah | + 2.59% | |
| Massachusetts | + 2.24% | |
| Ohio | + 1.49% | |
| Texas | - 1.92% | |
| Illinois | - 1.97% | |
| Florida | - 3.48% | |
| Mississippi | - 4.11% | |
| Tennessee | - 4.78% | |
| Arkansas | - 5.04% |
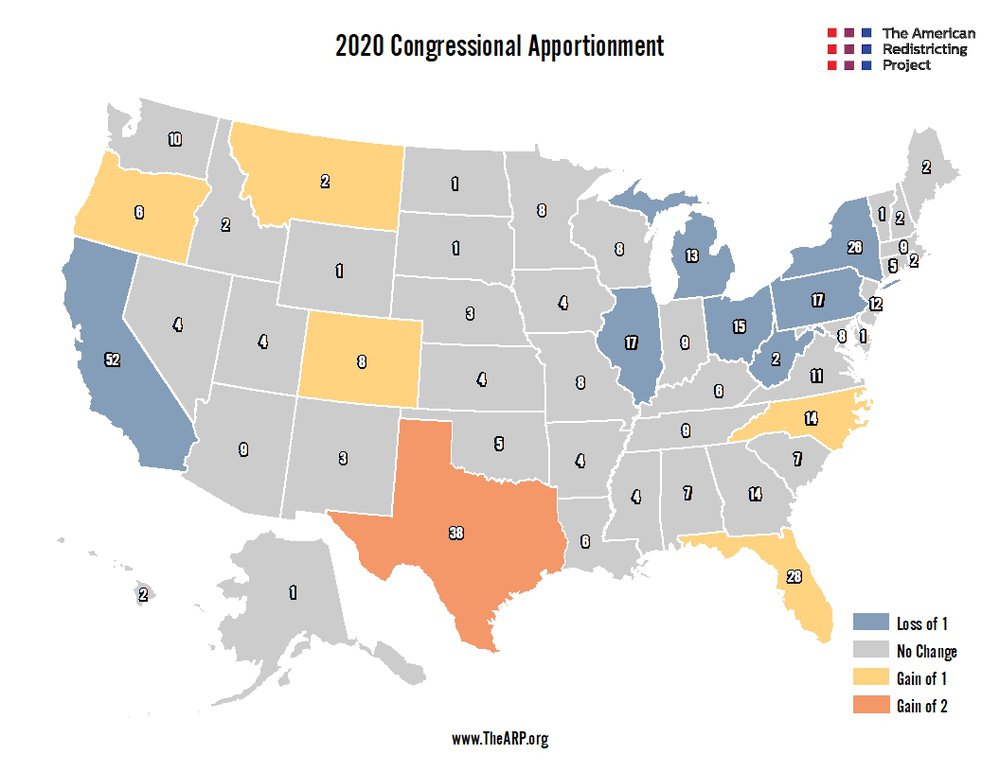
Official 2020 Congressional Apportionment
As covered in our 2020 Apportionment Blog Post, each State’s population totals as reported by the federal decennial census are used to reapportion seats in the U.S. House of Representatives amongst the states using the method of equal proportions. In the latest Congressional Reapportionment, the official 2020 Census state population figures resulted in Florida, North Carolina, Colorado, Oregon, and Montana each gaining one, and Texas gaining two, congressional seats, while California, Illinois, Michigan, Ohio, West Virginia, Pennsylvania, and New York each lost a seat, as shown below.
The Census Bureau’s PES report reveals, however, statistically significant counting errors impacted the 2020 Census official population figures in 14 States and, due to the nature of the method of equal proportions, these errors had a direct impact on the result of the 2020 Congressional Apportionment. Using the report’s estimated net overcount and undercount rates in conjunction with the official results of the 2020 Census, one can calculate the estimated total population in the affected States and determine how the 2020 Congressional Apportionment would have changed had these counting errors not occurred.
Alternate 2020 Congressional Apportionment
The table below shows the 14 States’ total populations as reported by the 2020 Census and the estimated number of persons missed or counted erroneously in each according to the PES overcount and undercount rates.
| Official 2020 Population | Corrected 2020 Population | Raw Miscount | |
|---|---|---|---|
| Hawaii | 1,460,137 | 1,360,994 | + 99,143 |
| Delaware | 990,837 | 936,836 | + 54,001 |
| Rhode Island | 1,098,163 | 1,042,706 | + 55,457 |
| Minnesota | 5,709,752 | 5,492,781 | + 216,971 |
| New York | 20,215,751 | 19,520,329 | + 695,422 |
| Utah | 3,275,252 | 3,190,423 | + 84,829 |
| Massachusetts | 7,033,469 | 6,875,919 | + 157,550 |
| Ohio | 11,808,848 | 11,632,896 | + 175,952 |
| Texas | 29,183,290 | 29,743,609 | - 560,319 |
| Illinois | 12,822,739 | 13,075,347 | - 252,608 |
| Florida | 21,870,527 | 22,631,621 | - 761,094 |
| Mississippi | 2,963,914 | 3,085,731 | - 121,817 |
| Tennessee | 6,916,897 | 7,247,525 | - 330,628 |
| Arkansas | 3,013,756 | 3,165,649 | - 151,893 |
The following map shows how the 2020 Congressional Apportionment would have changed if each State’s total population were accurately reported by the 2020 Census. California, Illinois, Ohio, Michigan, West Virginia, Pennsylvania, and New York would each still have lost a seat, but Minnesota and Rhode Island would each have lost a seat as well. North Carolina, Montana, and Oregon would each still have gained a seat, but Texas and Florida would each have gained three seats instead of two and one, respectively, while Colorado would not have gained any.

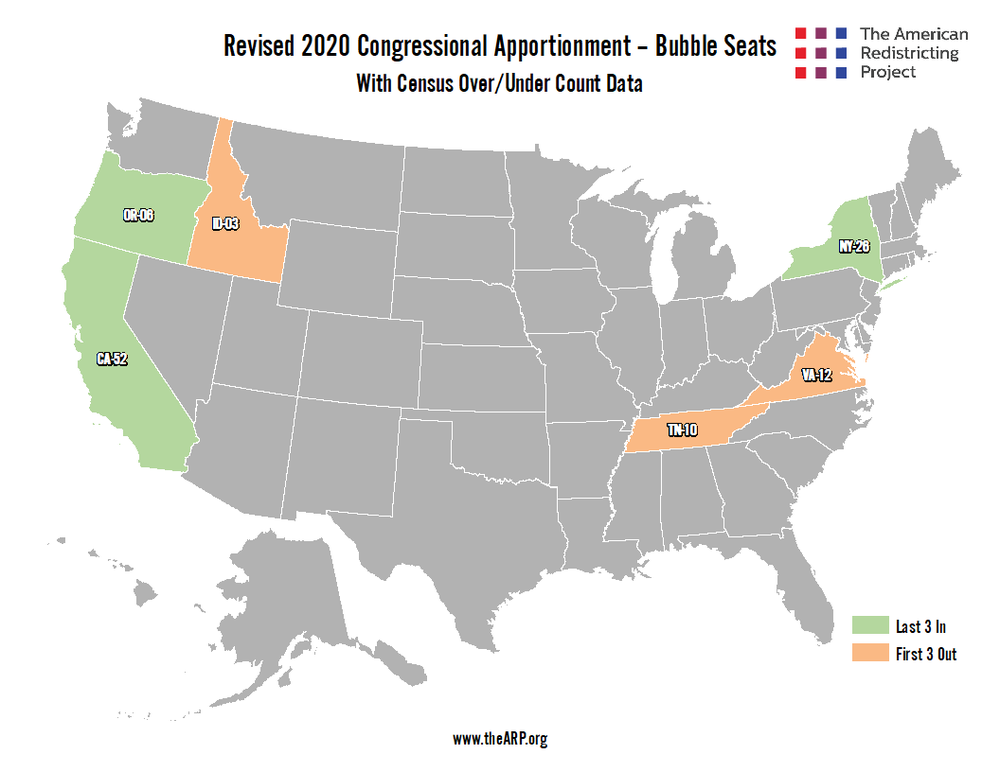
The following list and map shows what the “bubble seats” would have been in this corrected Congressional Apportionment:
- Safest 3: CA-51, TX-39, FL-30
- Last 3 In: OR-06, NY-26, CA-52
- First 3 Out: TN-10, ID-03, VA-12
- Next 3 Out: AZ-10, CO-08, TX-40