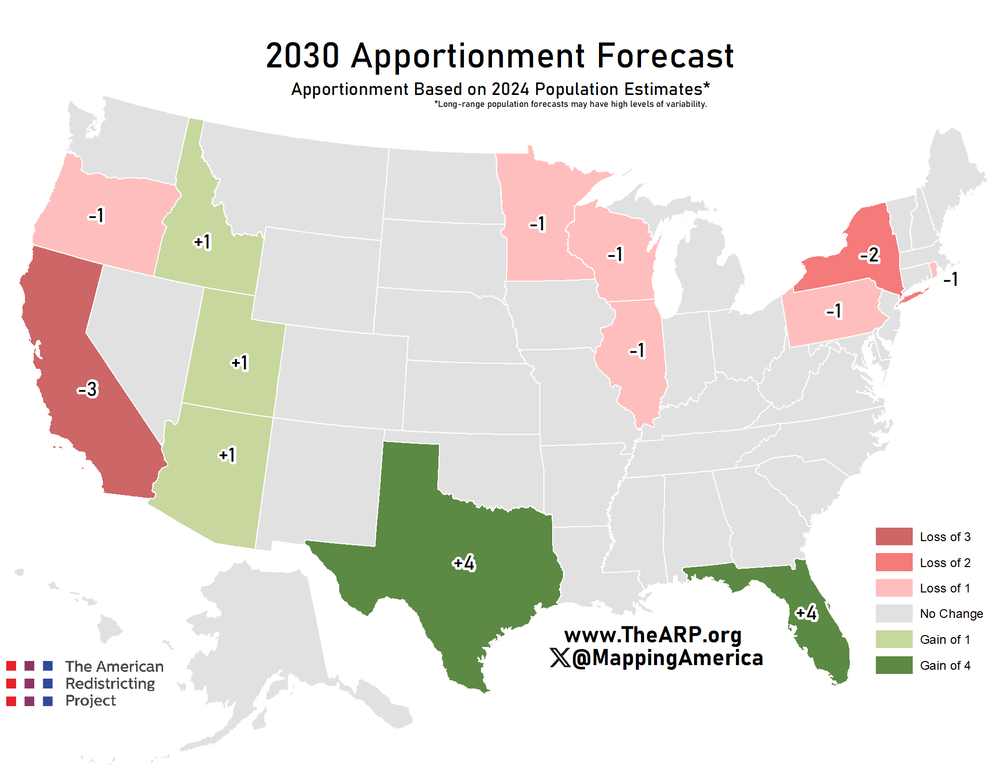
Congressional representation is reapportioned every decade following the completion of the decennial census. The Census Bureau's most recent Population and Housing Unit Estimates were released December 19, 2024.
METHODOLOGY
A weighted average growth rate is applied to the July 1, 2024, estimates of the resident population of the United States from the Census Bureau to produce a forecast for the 2030 apportionment.

BUBBLE SEATS
The following seats are the last six seats apportioned and the first four left out. These 6 seats are "On the Bubble". Small changes in population will determine which of these seats end up part of the 123rd - 127th congresses.
Safest 3 In
Seat 430: TX-42
Seat 431: FL-32
Seat 432: IL-16
Last 3 In
Seat 433: MI-13
Seat 434: AL-07
Seat 435: CA-49
First 3 Out
Seat 436: NC-15
Seat 437: NY-25
Seat 438: GA-15
Next 3 Out
Seat 439: WI-08
Seat 440: TX-43
Seat 441: TN-10
DOMESTIC v. INTERNATIONAL MIGRATION
National Growth
The United States grew by 3,289,831 people according to the 2024 estimates. As reported by the Associated Press, the Census Bureau modified its methodology this year to include individuals in the United States as humanitarian parolees (i.e. refugees). If these individuals continue to reside in the United States on Census Day 2030 they would be counted as residents for the purpose of apportionment. Inclusion of these persons in the annual estimates does help to better calibrate the apportionment forecasts for the next decade.
Domestic Migration
23 states lost population via domestic migration. The five states with the largest declines were:
California: -239,575
New York: -120,917
Illinois: -56,235
New Jersey: -35,554
Massachusetts: -27,480
27 states gained population via domestic migration. The top 5 growth states are:
Texas: +85,267
North Carolina: +82,288
South Carolina: +68,043
Florida: +64,017
Tennessee: +48,476
International Migration
July 2023 to July 2024 saw the highest rate of international migration this decade.
2023-2024: 8.23%
2022-2023: 6.84%
2021-2022: 5.08%
2020-2021: 1.13%
Every state experienced population growth via international migration. The top 5 and bottom 5 states are:
1) Florida: +411,322
2) California: +361,057
3) Texas: +319,569
4) New York: +207,161
5) New Jersey: +130,692
...
46) West Virginia: +2,841
47) Vermont: +2,024
48) South Dakota: +1,616
49) Wyoming: +1,285
50) Montana: +506
2023-2024 POPULATION CHANGES: HIGHLIGHTS & LOWLIGHTS
Florida, Texas, and Utah Lead the Nation
Florida grew by 2.0% from July 2023 to July 2024 - gaining 467,347 residents.
Texas and Utah followed. Both saw 1.8% growth rates. Texas added 562,941 residents while Utah added 60,391.
Nine States Gained More Than 100,000 Residents from July 2023 to July 2024
Texas: +562,941 (+1.8%)
Florida: +467,347 (+2.0%)
California: +232,570 (+0.6%)
North Carolina: +164,835 (+1.5%)
New York: +129,881 (+0.7%)
New Jersey: +121,209 (1.3%)
Georgia: +116,446 (+1.1%)
Arizona: +109,357 (+1.5%)
Washington: +100,860 (+1.3%)
Three States Lost Population from July 2023 to July 2024
Mississippi: -127 (-0.0004%)
Vermont: -215 (-0.03%)
West Virginia: -516 (-0.03%)
2020-2024 POPULATION CHANGES: HIGHLIGHTS & LOWLIGHTS
Two states gained more than 1 million residents since 2020:
Texas: +2,141,373 (+7.3%)
Florida: +1,834,023 (+8.5%)
Five more states gained more than 300,000 residents since 2020:
North Carolina: +604,525 (+5.8%)
Georgia: +467,123 (+4.4%)
Arizona: +424,274 (+5.9%)
South Carolina: +360,579 (+7.0%)
Tennessee: +315,403 (+4.6%)
Seven states lost population since 2020:
New York: -336,524 (-1.7%)
California: -124,411 (-0.3%)
Illinois: -111,656 (-0.9%)
Louisiana: -60,134 (-1.3%)
West Virginia: -23,757 (-1.3%)
