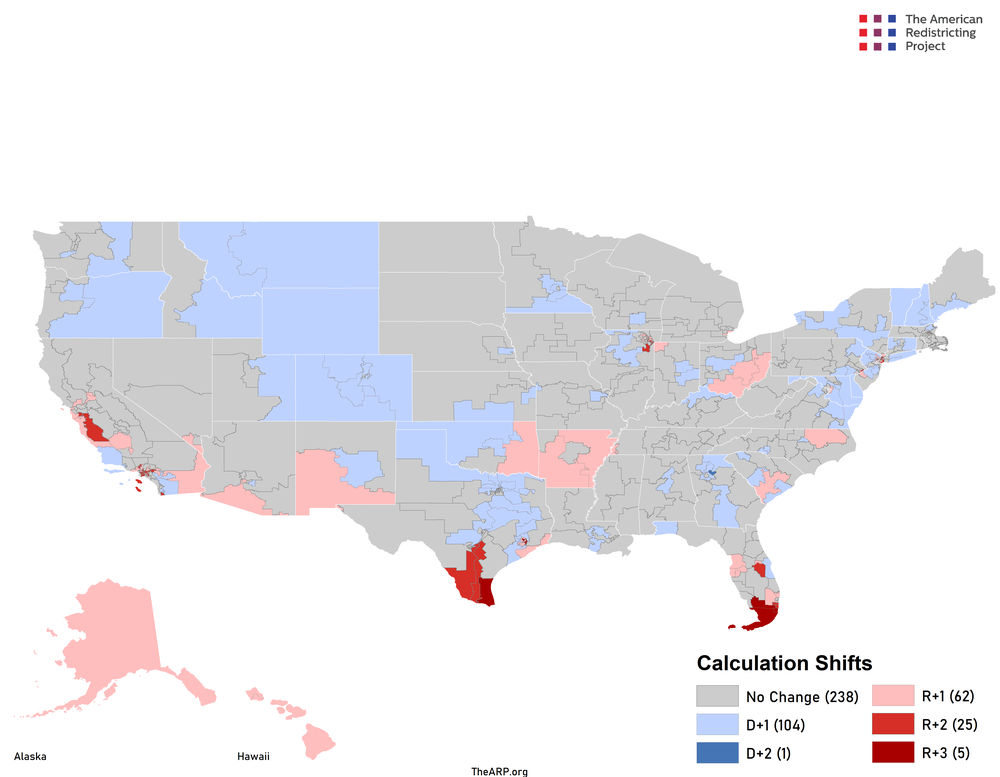
The Cook Partisan Voter Index (PVI) has historically utilized the two-party presidential results of the last two previous elections, weighted equally, to calculate each cycle's PVI. Last week, Cook announced a new PVI formula that weighs the 2020 two-party results 3-to-1 over the 2016 two-party results.
The new formula changes the indices for less than half of the congressional seats and only 7% of the seats change more than a single point. The areas with the most significant shifts were those that swung heavily in one direction in 2020 as compared to their performance in the 2016 election.
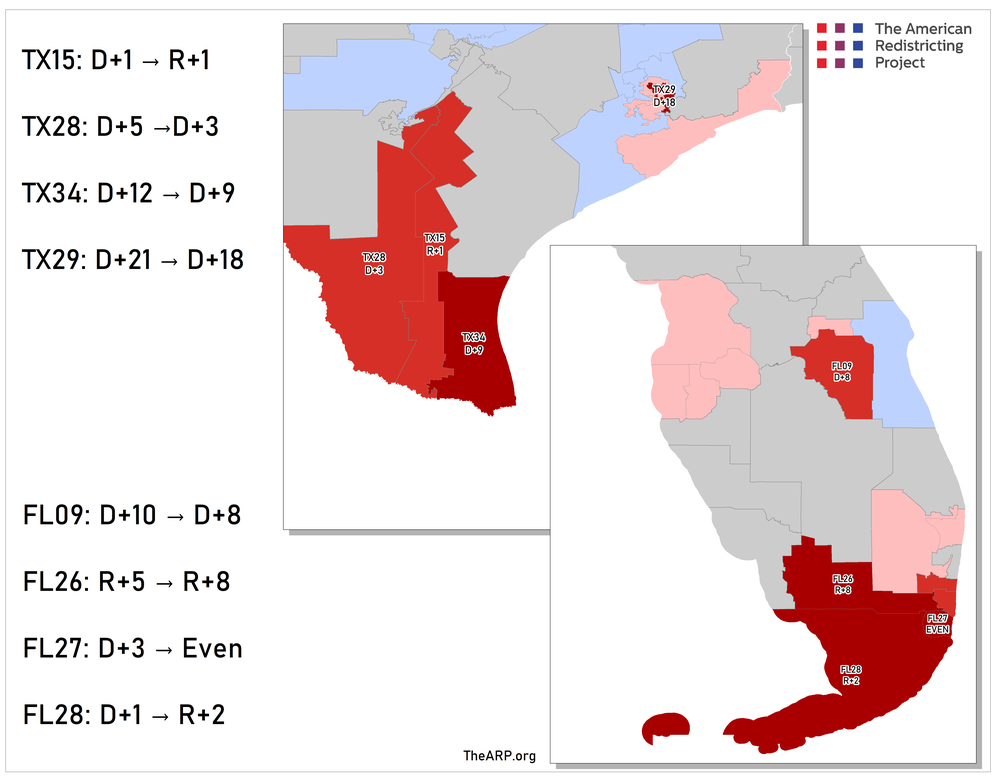
Some of the largest shifts in the index come from the evolving political preferences of Hispanic voters in Florida and Texas.
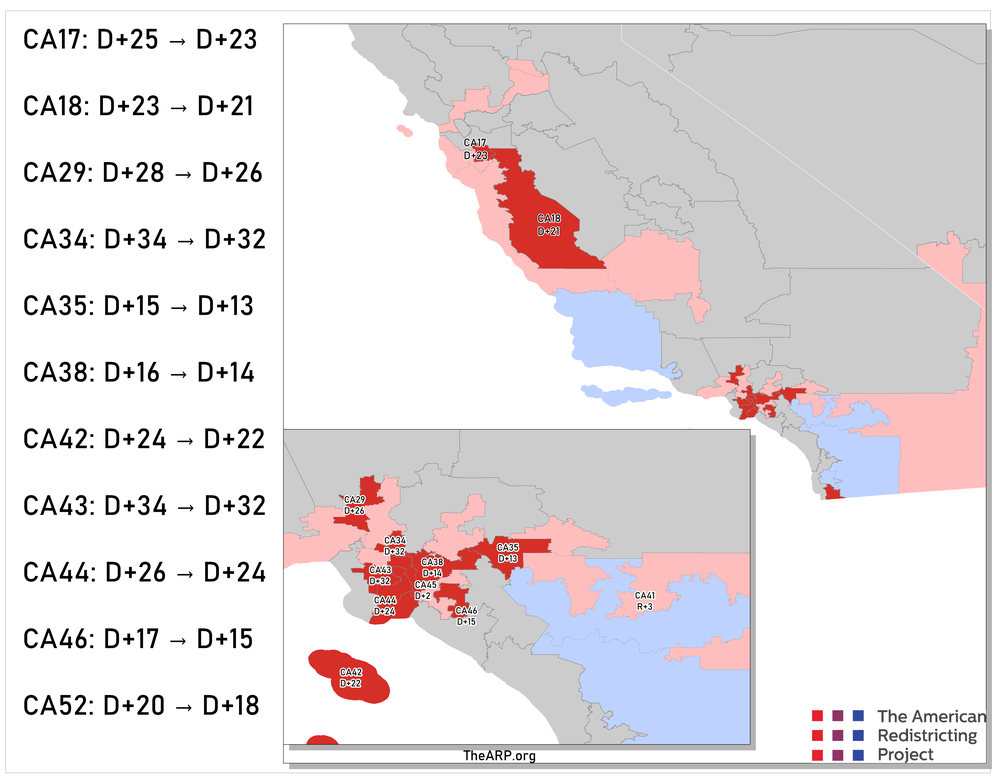
California had 11 of its 52 districts move 2 points right:
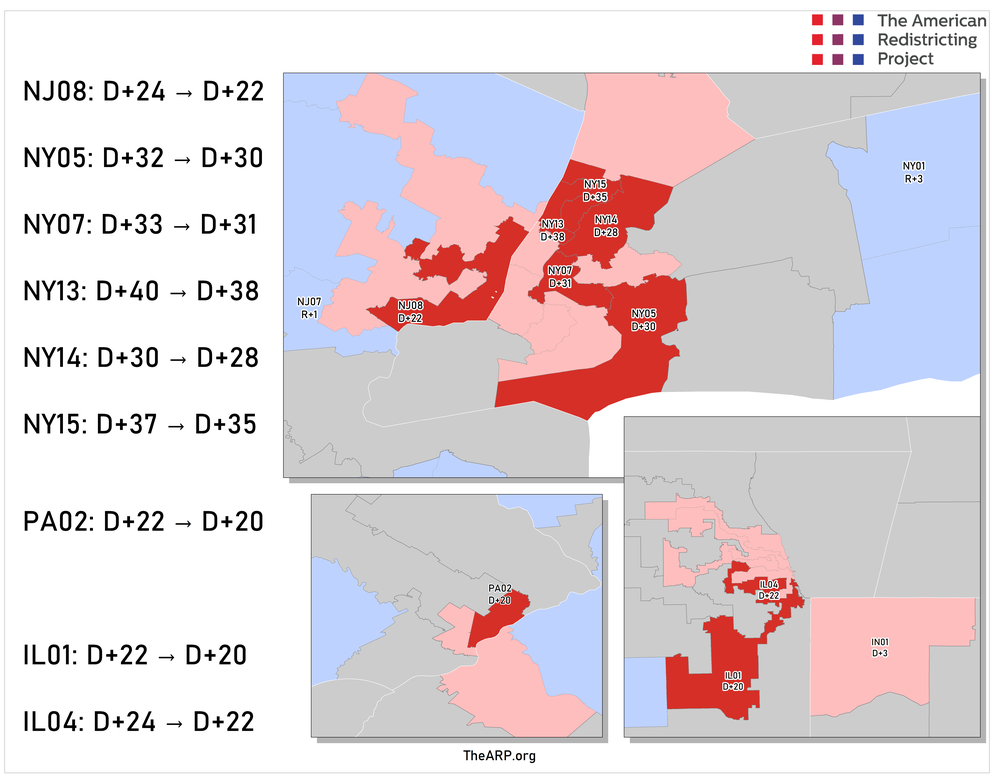
9 districts spread across Chicago, the NYC Metro, and Philadelphia also shift 2 points right:
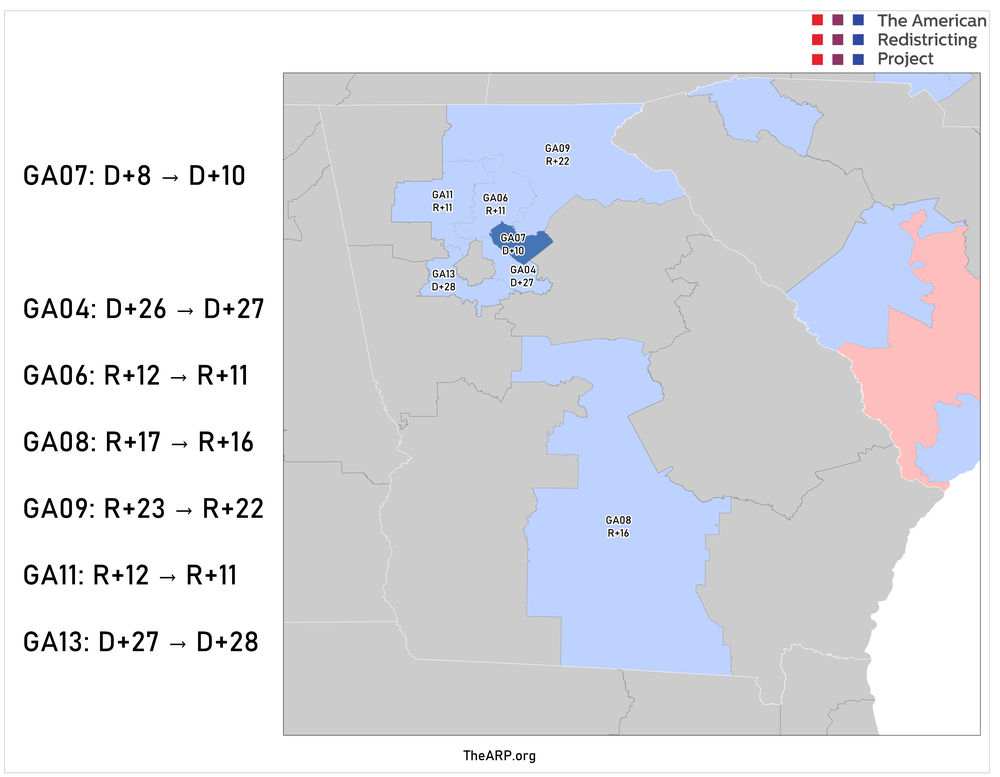
Only one district in the country shifts left by more than 1 point, GA07. 6 other Georgia seats move left (and 0 move right):
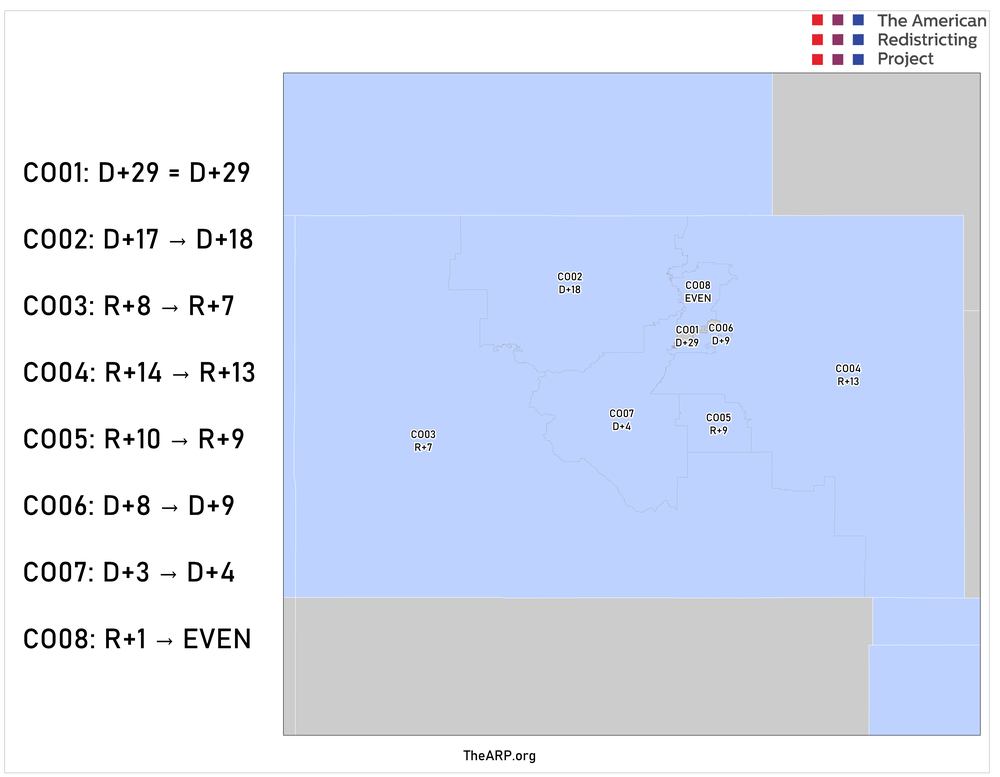
7 of Colorado's 8 seats shift left by 1 point:
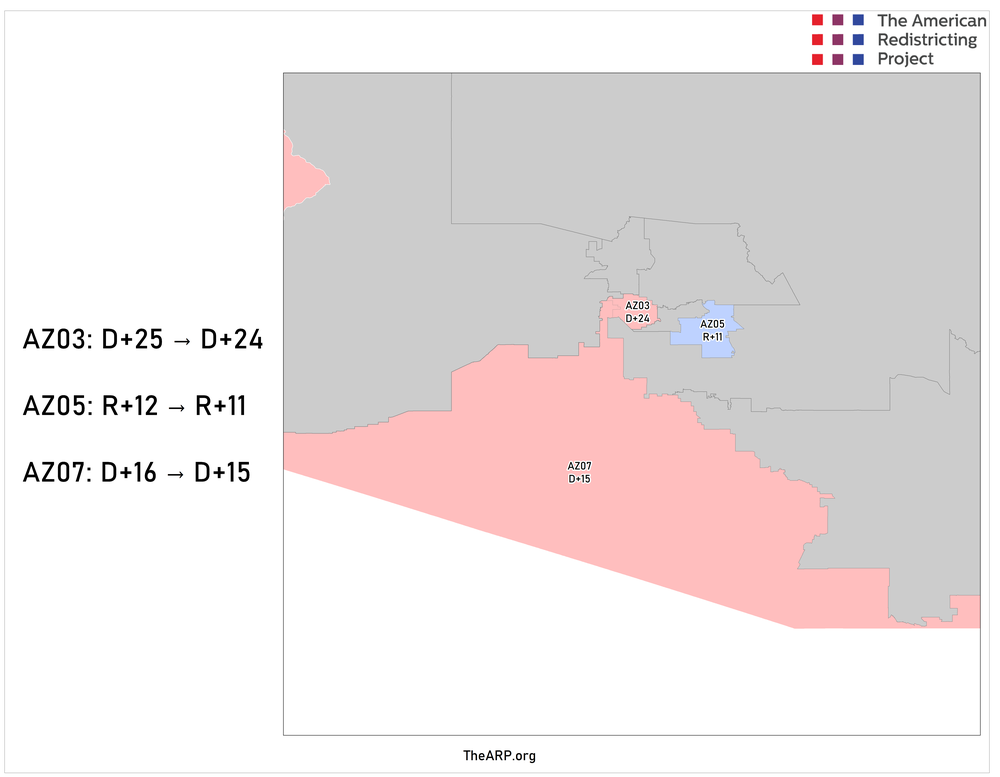
The two bluest seats in Arizona move 1 point right and one of the reddest moves 1 point left:
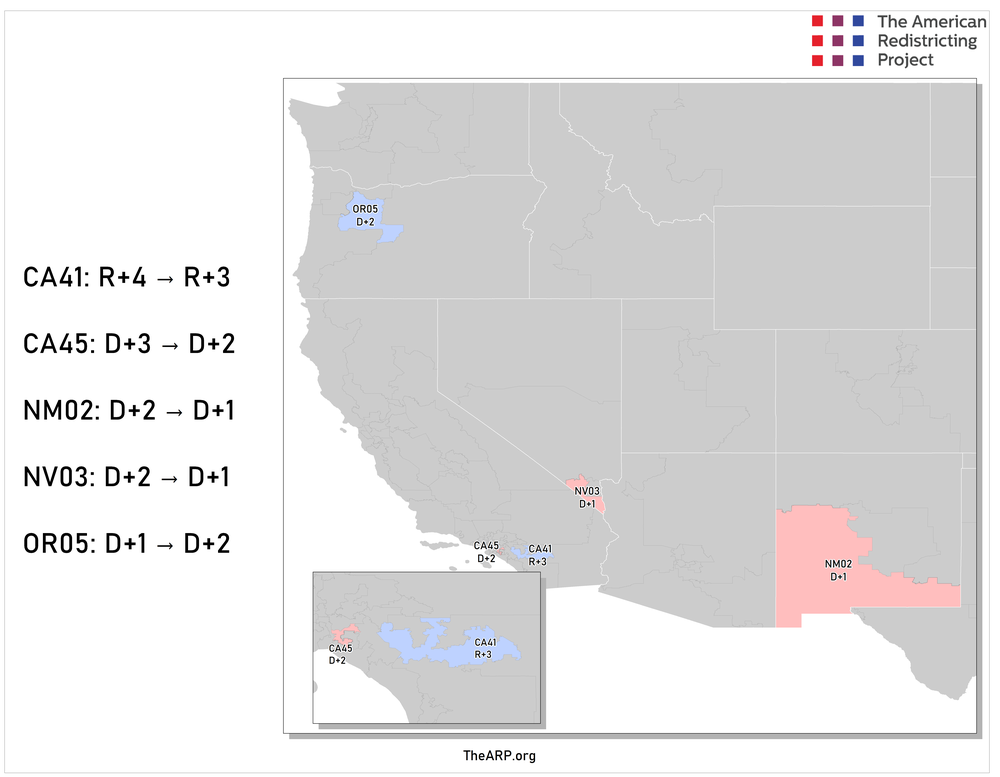
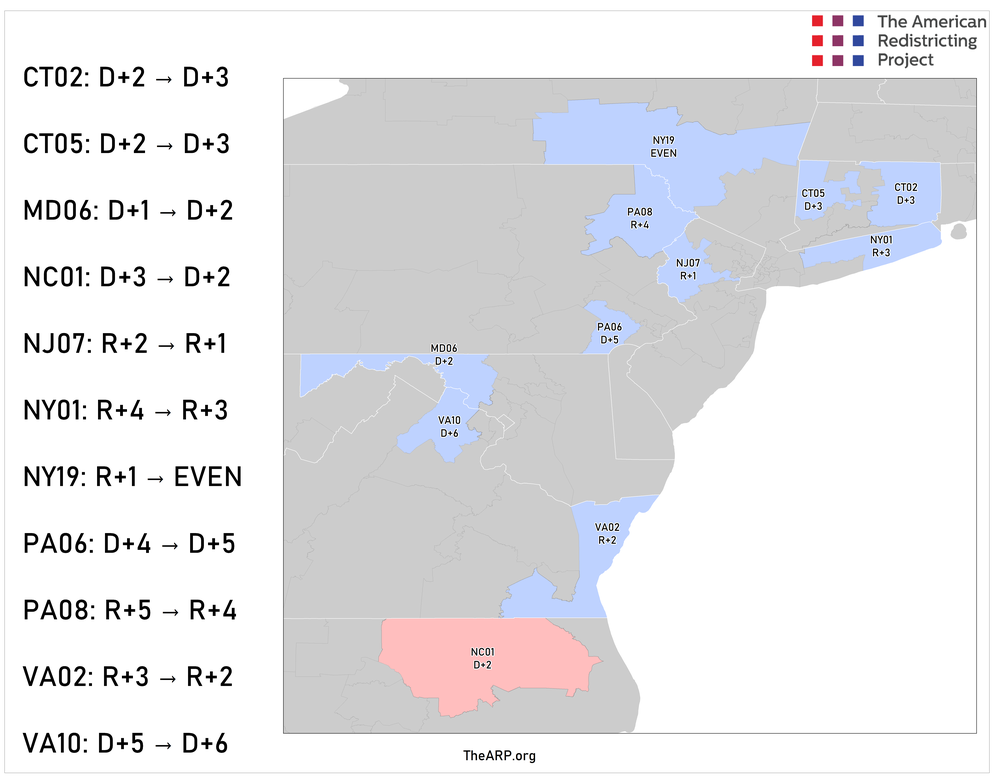
Several of the most closely watched seats for the 2022 elections also saw moderate shifts as a result of the new formula.
In the East:
In the Midwest and Great Plains:

And in the West: